


09/15/2025
LEAD-ACID WITH DATA: LESS TRIAL AND ERROR, MORE PREDICTABILITY.
Quality control with advanced techniques, innovation projects, and standardized testing guiding decisions and opening new opportunities.


Predictability is Key
Manufacturing lead-acid batteries today means operating under cost pressure, warranty targets, tight deadlines, and ESG commitments. Competitive advantage comes from stable processes and data-driven decisions — from raw materials to the final product. This is where physicochemical and microstructural characterization makes the difference: measuring what matters to reduce variability, shorten formation, and extend service life, with clear visibility of the return.
Based in Curitiba-PR, Brazil, the SENAI Institute of Innovation in Electrochemistry (ISI-EQ) supports manufacturers with an integrated package:
XRD (X-ray diffraction) with phase quantification in cured and formed plates — including ?-PbO? and ?-PbO? to assess the degree of formation.
SEM/EDS (scanning electron microscopy with energy-dispersive spectroscopy) for crystal size and morphology (3BS/4BS) and elemental mapping.
Carbon and sulfur (C/S) elemental analysis for additives, raw materials, and to infer positive plate formation (residual sulfur).
Laser diffraction for leady oxide particle size distribution.
Standardized electrical charge/discharge tests (DIN/SAE/ABNT) to validate performance effects.
The result: less trial and error, more predictability.
Where the pain points lie:
- Improper distribution of leady oxide (D10/D50/D90 out of range), leading to inconsistent paste and irregular plates.
- Heterogeneous curing and unbalanced 3BS/4BS ratios, prolonging formation time and dispersing battery capacity.
- Oversized or poorly distributed 3BS/4BS crystals, increasing delamination risk and field failures.
- Lack of Carbon/Sulfur (C/S) and other element tracking in additives/raw materials and residual sulfur in formed positive plates, hindering correlation between raw material, process, and performance.
- Misalignment between phase targets and formation profiles, increasing energy consumption per Ah and lead time.
Impact: Reduced efficiency, high scrap rates, excessive energy consumption during formation, elevated warranty costs, and damage to brand reputation.
What changes when we measure what really matters?
Some critical process points and how we ensure quality:
Laser diffraction of leady oxide
Determines particle size distribution (D10/D50/D90), enabling precise alignment of oxide production, paste mixing, pasting, and curing. Proper granulometry improves pasting, useful porosity, and curing uniformity.
XRD with phase quantification
Quantifies 3BS/4BS, PbO (massicot/litharge), and other phases in cured plates, defining curing targets per product family and identifying potential contamination. In formed plates, XRD quantifies ? and ?-PbO?, enabling evaluation of formation and adjustment of process profiles.
SEM/EDS (image analysis + elemental mapping)
Assesses size, morphology, and distribution of 3BS/4BS crystals, detects contaminants and alloy segregations. Guides adjustments of humidity, temperature, and curing time to reduce delamination and batch variability.
C/S elemental analysis
Determines carbon content in additives (influencing dispersion/wettability in negative plates) and sulfur in raw materials. In formed positive plates, residual sulfur indicates remaining sulfates, aiding in assessing degree of formation and refining formation algorithms.
Standardized electrical tests
Measurements of capacity (e.g., C20/C10), charge acceptance and retention, water loss, CCA/CA, and relevant cycling. These tests close the loop, proving — in compliance with standards — the effect of corrections in materials and processes on performance.
Figures 1, 2, and 3 show examples of cured plate and lead oxide characterization. Monitoring and controlling the process ensures agility in corrections, preventing nonconformities.
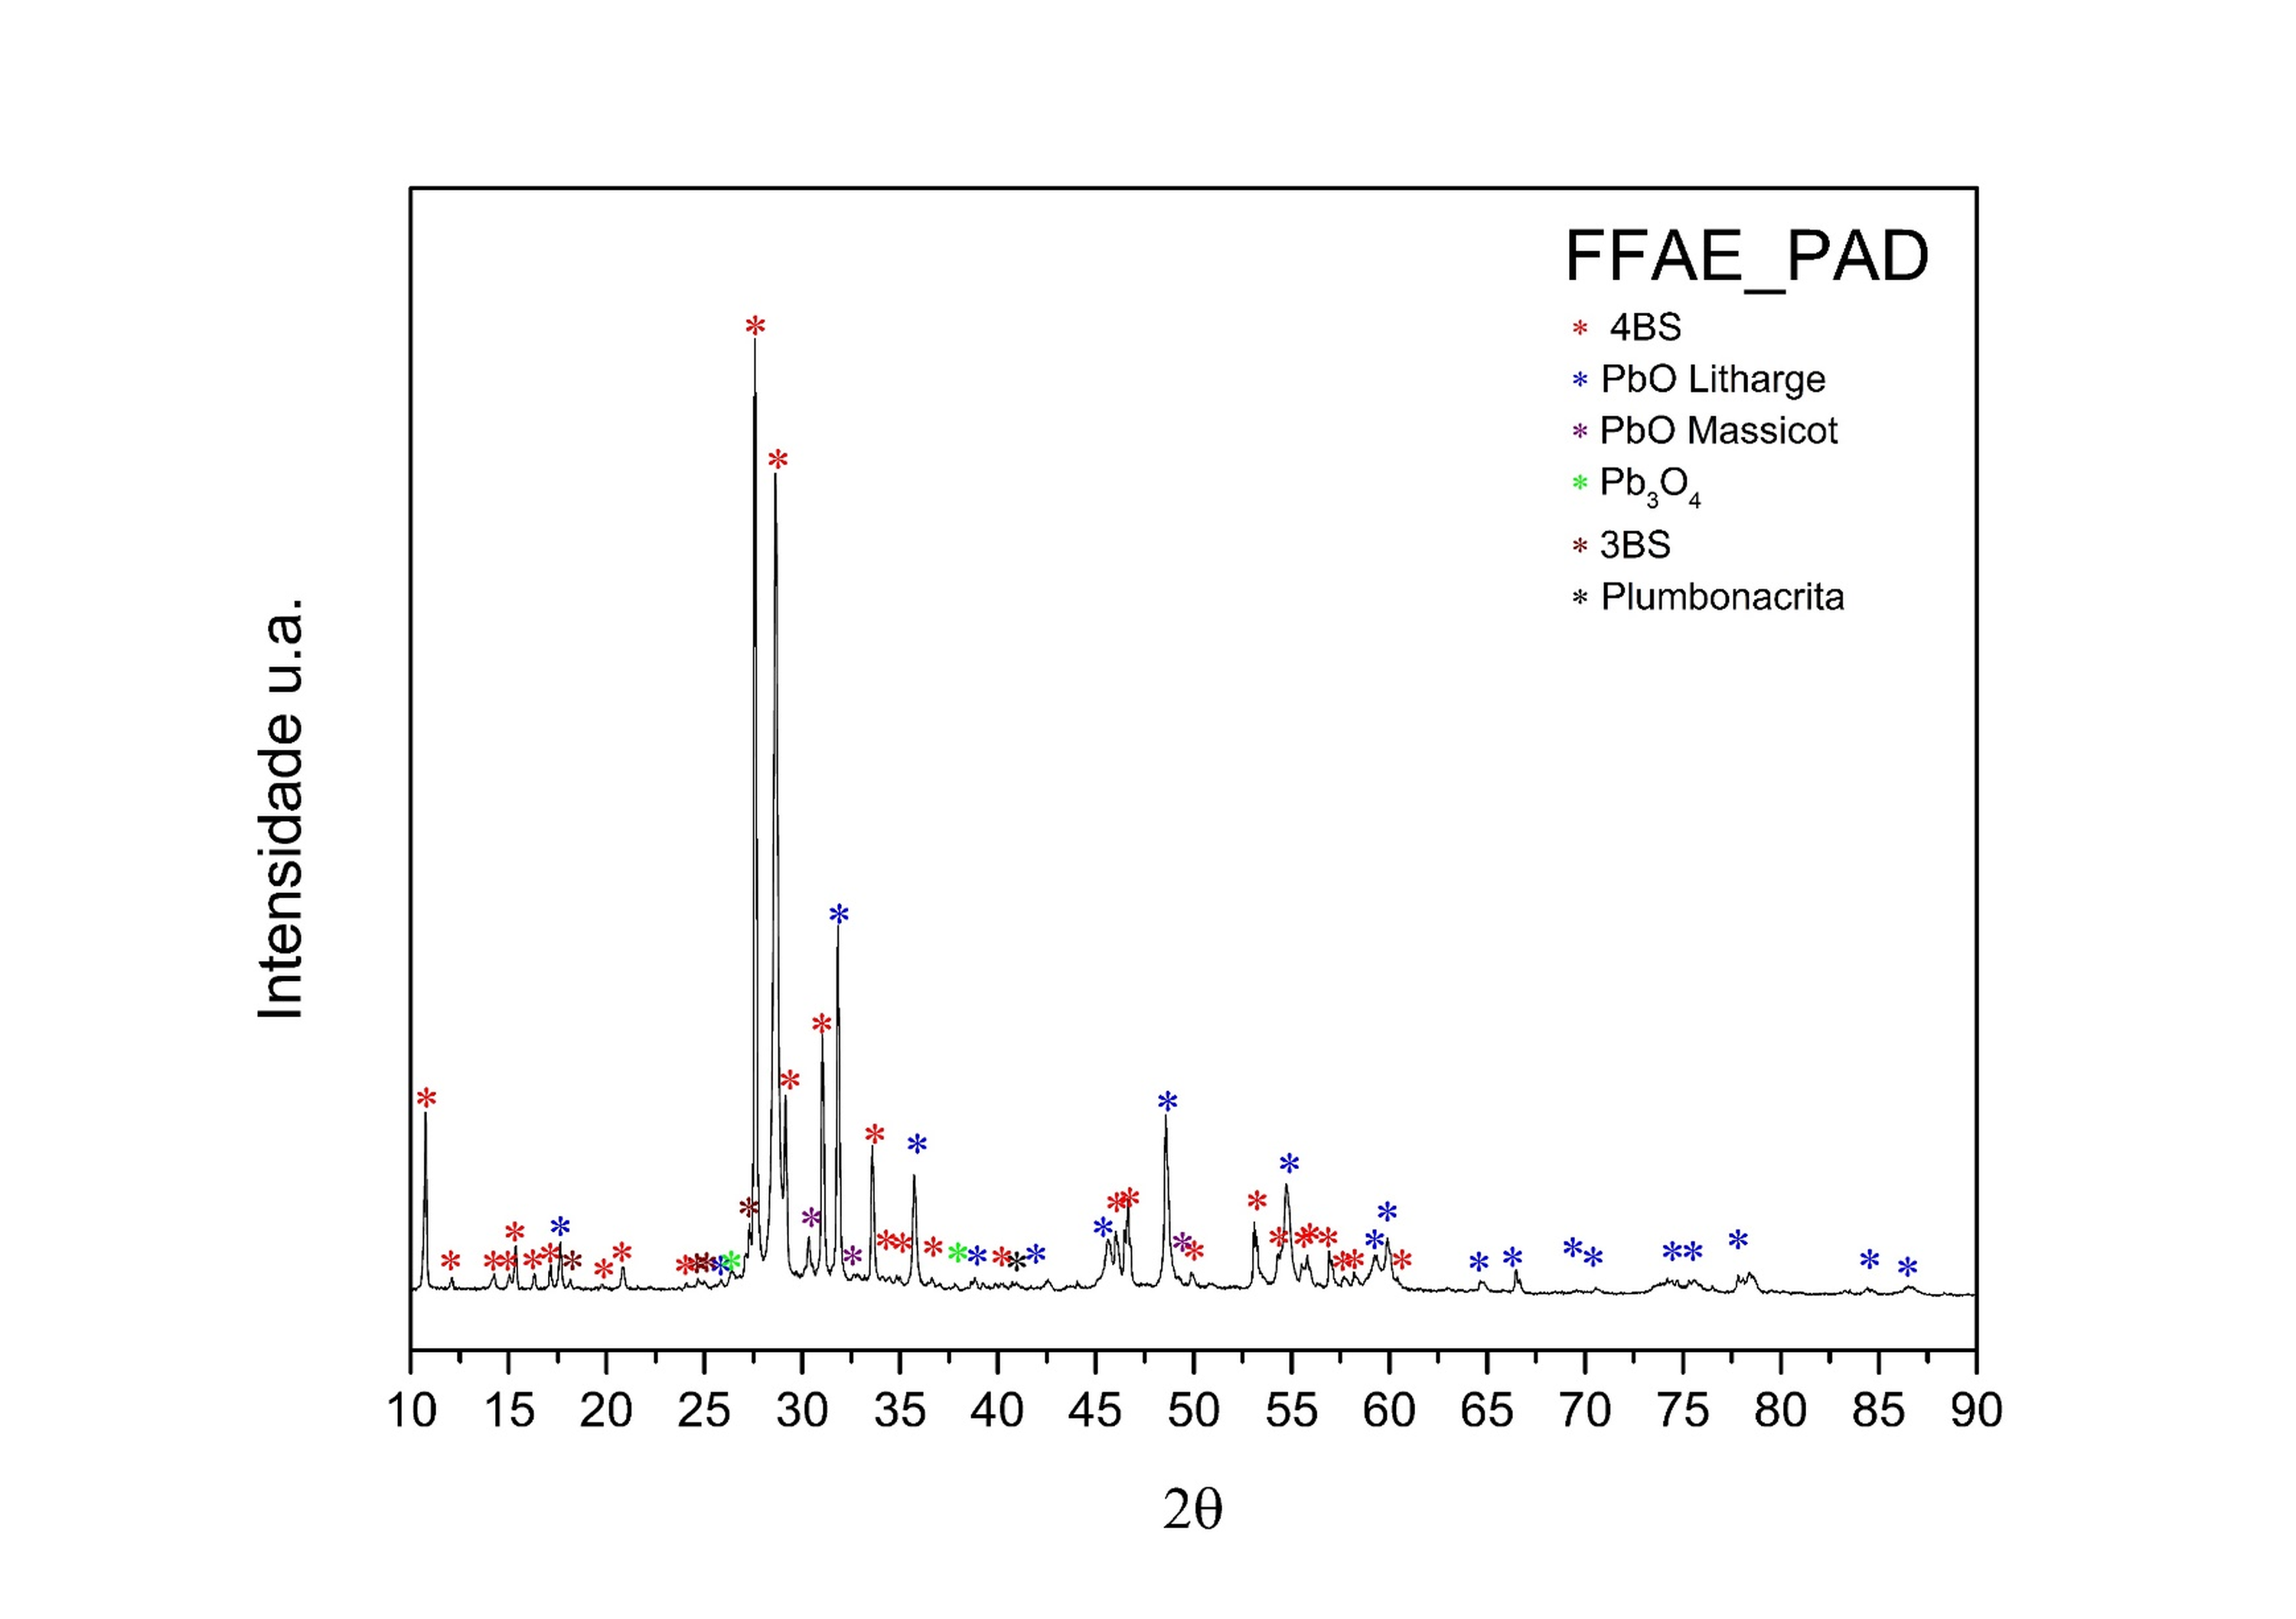
Fig. 1 — XRD diffractogram of a cured plate. ISI-EQ uses Rietveld Refinement in XRD to quantify crystalline phases, which is essential for assessing curing quality.
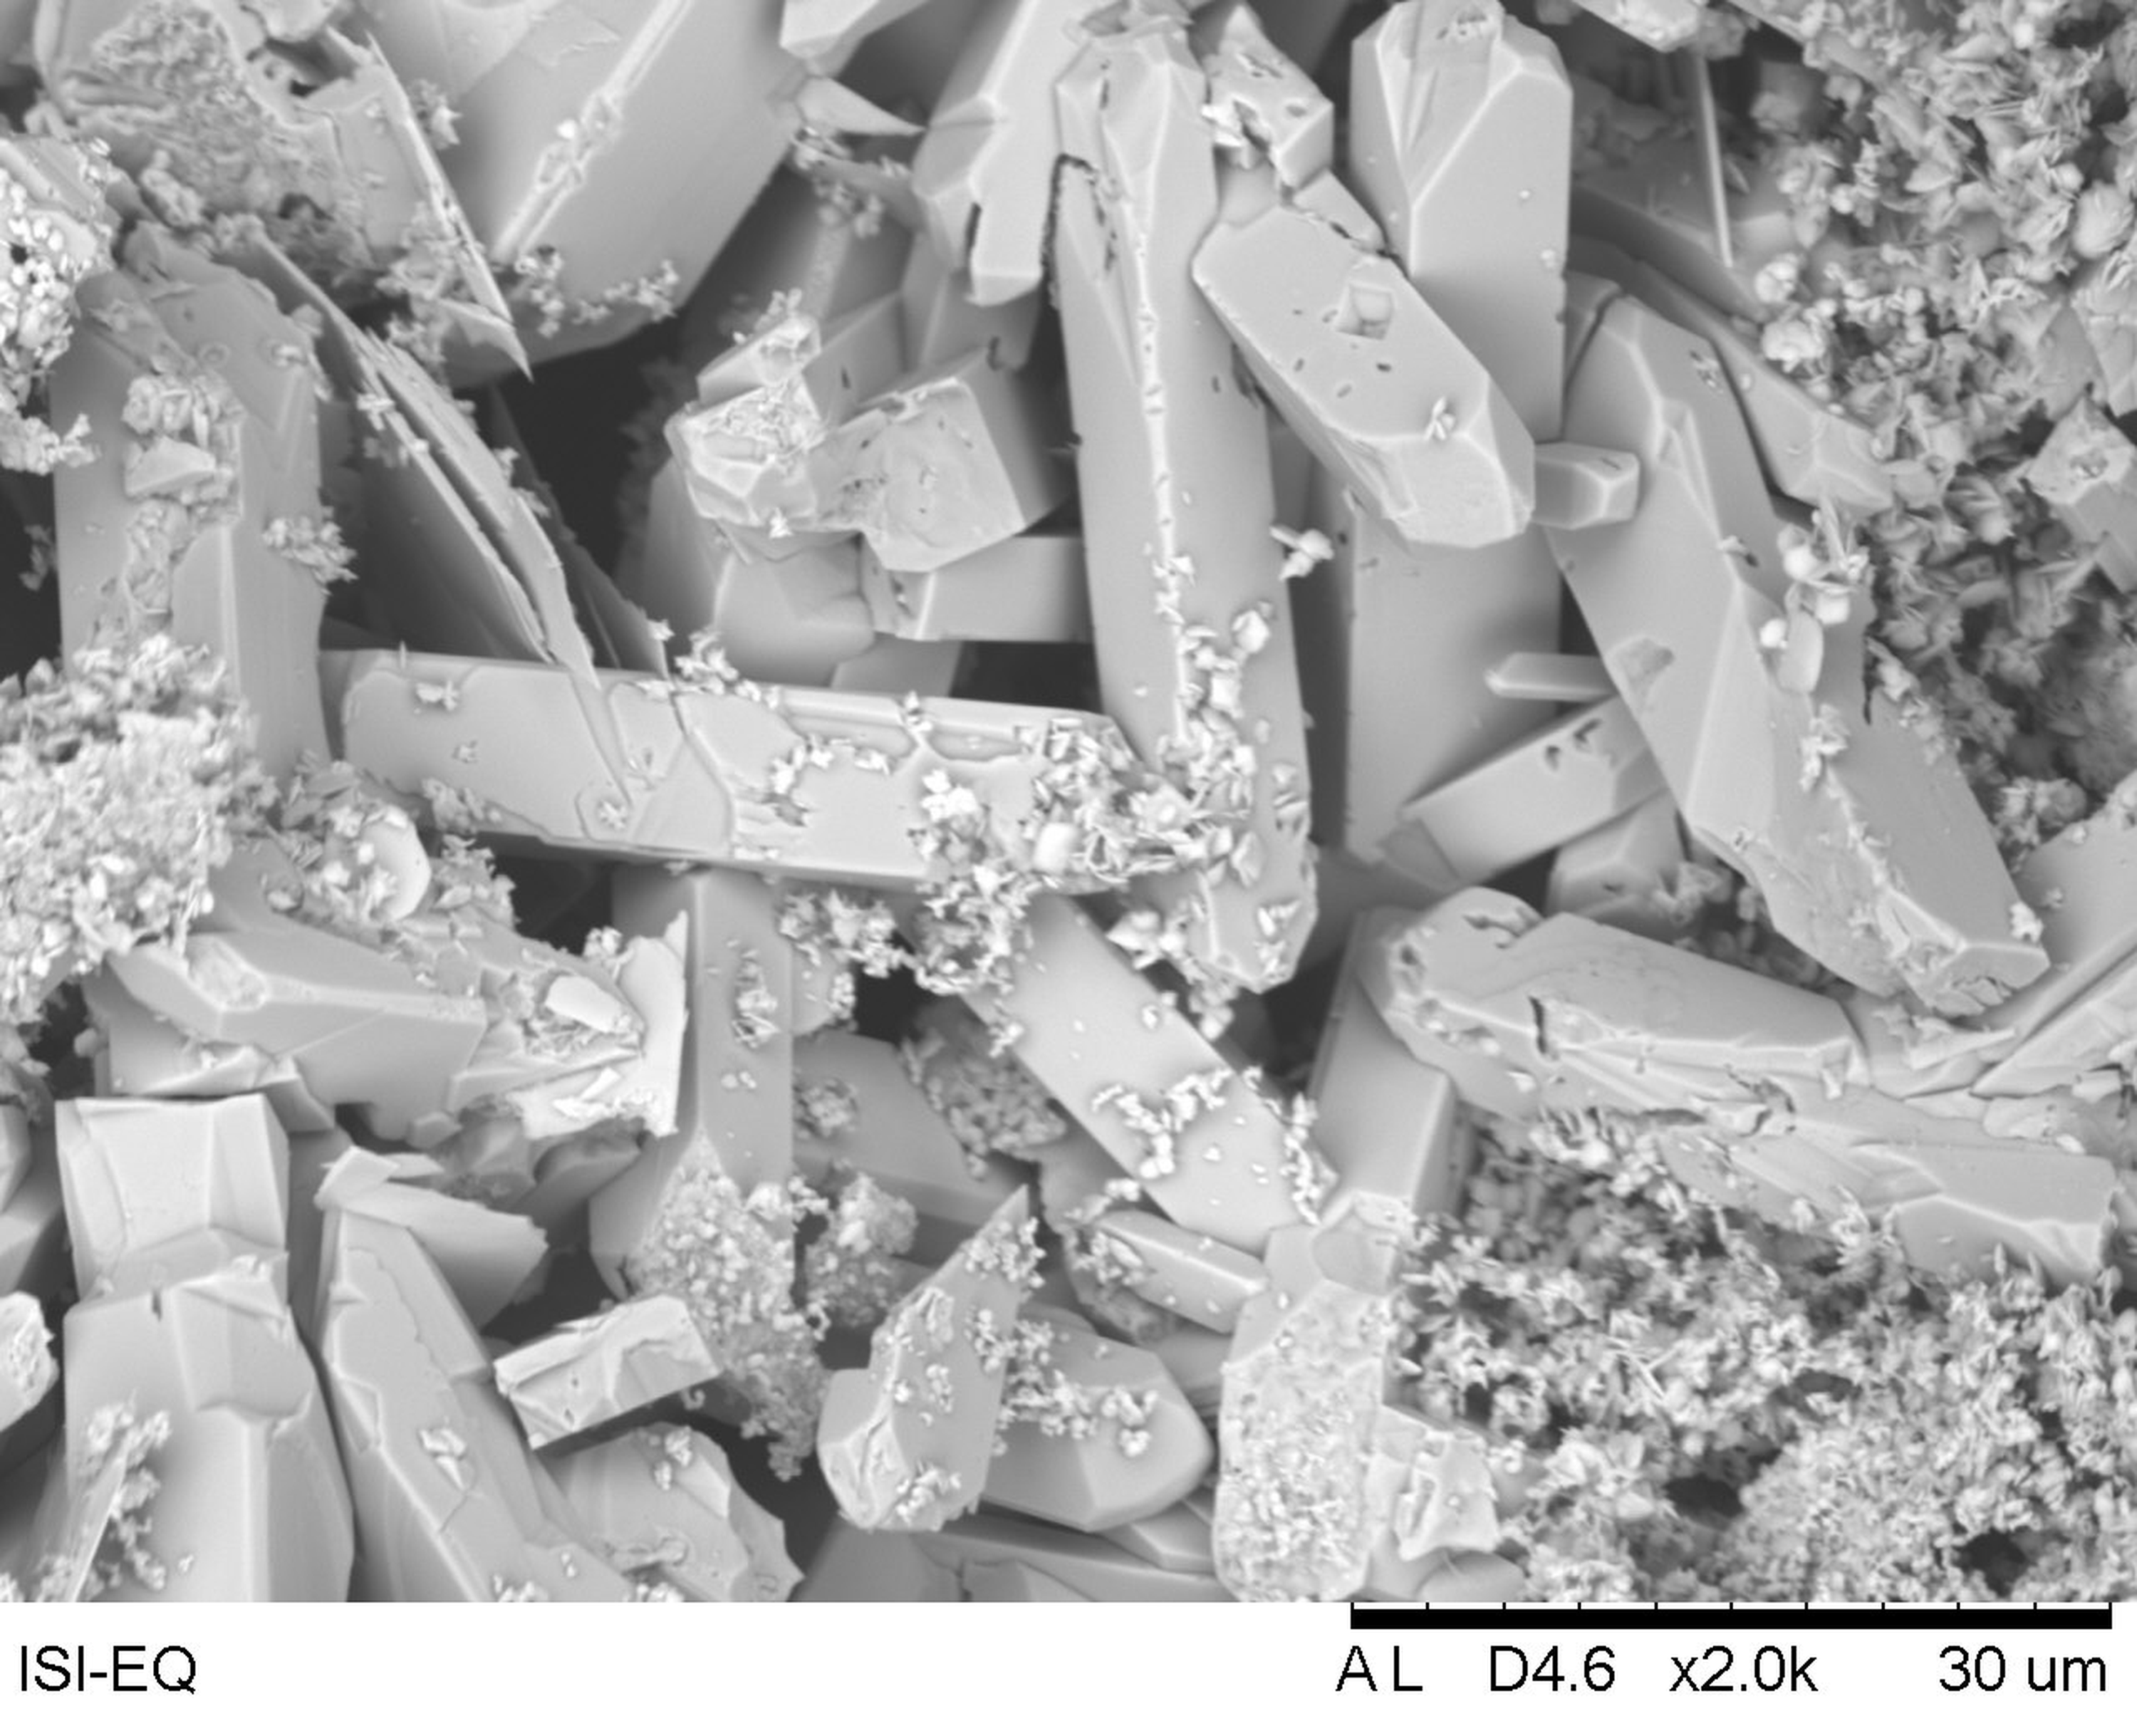
Fig. 2 — SEM image showing 4BS crystals in a cured plate. The size and distribution of the crystals influence plate formation and properties, while elemental maps identify contaminants or segregations.
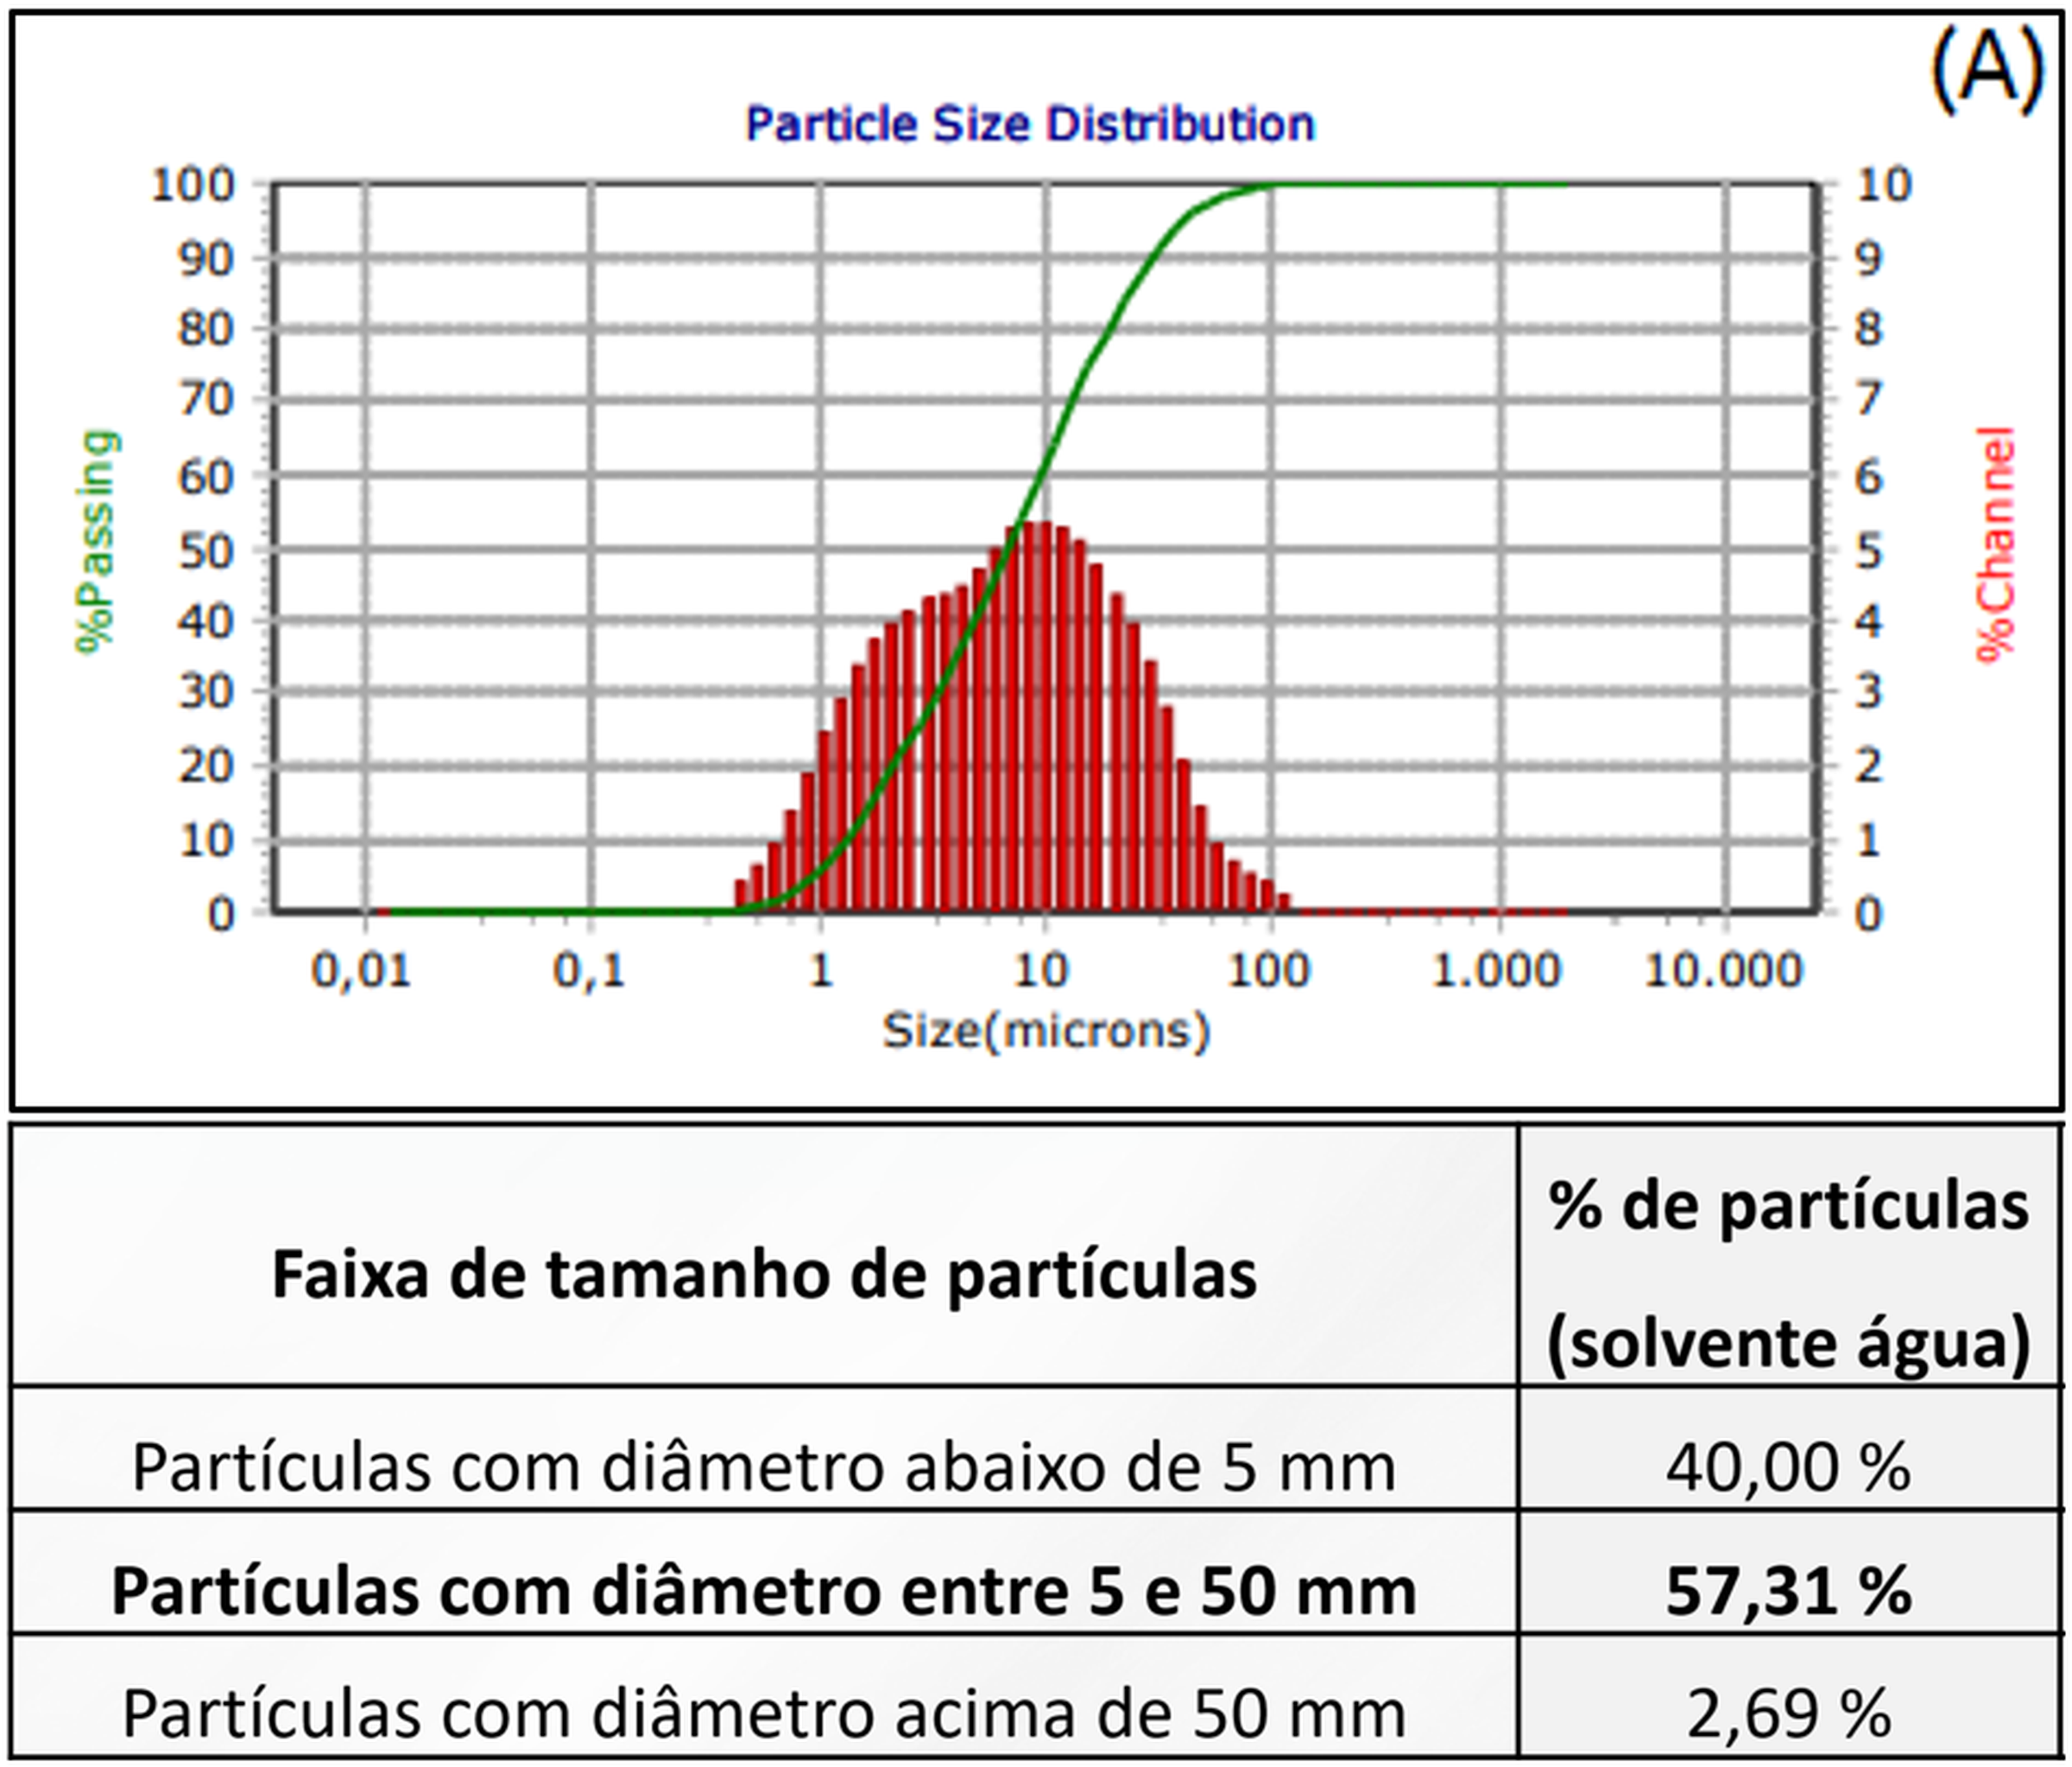
Fig. 3 — Particle size distribution of leady oxide with D10/D50/D90. Periodic control of the produced oxide is essential to ensure reproducibility.
1. Embrapii
Development/innovation with agile contracting via Embrapii Unit (ISI-EQ). Typical funding split:
-Company: 45%
-Embrapii: 33%
-SENAI: 22%
*validate current call
2. Embrapii Sebrae (SMEs/Startups)
Company + Sebrae: 30% of the total (70/30; Sebrae limit of R$ 300k), Embrapii: 50%, SENAI: 20%; modalities DT/ET/AT.
In practice, the company may contribute less than 10% of the total project.
*validate current call
3. SENAI Industrial Alliance Mover
Automotive sector challenges; CNAE 27.22 (or a letter confirming link to the automotive supply chain); ? 3 companies. Funding split:
Company: 20% financial + 20% economic (technical staff hours, equipment hours, etc.)
SENAI: 60%
*validate current call
How can ISI-EQ support the industry?
Process diagnosis
Sampling of leady oxide (laser diffraction), XRD (phases in cured plates and ?/?-PbO? in formed plates), SEM/EDS (3BS/4BS crystals and elemental maps), and C/S analysis (additives/raw materials and formed positive plates). Delivery of technical reports and risk mapping.
Test plan and DOE
Clear hypotheses (oxide particle size distribution, mixing/resting, curing parameters, and formation profile), definition of process windows, and experimental design to separate effects with appropriate sampling and statistics.
ISI-EQ pilot plant (unit operations)
We use our pilot plant, which replicates a factory’s unit operations, to develop and fine-tune new formulations while consuming far less material. We test and decide quickly, lock in critical parameters, and reduce risk before scale-up. Outputs: raw material specifications, process set-points, and acceptance criteria.
On-site pilots (industrial scale-up)
After validation in the pilot plant, we run controlled pilots in the factory to adjust pasting/curing/formation according to granulometry and phase targets, crystal size, and ?/?-PbO? ratios. Sampling by batch and recording of process and quality variables.
Method transfer and training
Standardization of SOPs (laser/XRD/SEM/EDS/C/S sampling; standardized tests), acceptance criteria, control routines, and training of Quality Control and R&D teams.
Indicator-based management (before/after)
Monitoring of formation time, energy per Ah, capacity dispersion (?), water loss, scrap, and field returns, with dashboards and performance results.
Case 1
Functionalized carbon additive to increase cycle life
Problem: High warranty return rate due to early performance loss in deep cycling.
Approach: Innovation project for the synthesis and functionalization of carbon additives, aiming to improve wettability and dispersion in the negative paste; complete process diagnosis and implementation of a quality control strategy at all stages (raw materials, paste, curing, and formation).
Tools and measurements: Carbon control in additives, laser diffraction (oxide particle size distribution), XRD (target phases in cured plates and ?/?-PbO? in formed plates), and SEM/EDS (3BS/4BS crystal size/morphology and elemental verification) to adjust curing/formation; standardized electrical tests to validate performance.
Result: Batteries with approximately twice the cycle life in deep-cycle testing; carbon functionalization improved dispersion (reduction of agglomerates) without increasing water loss.
Case 2
Alloy correction in positive plates (failure due to corrosion during formation)
Problem: Positive grids completely corroded by the end of formation, resulting in scrap and yield loss.
Approach: Metallographic investigation with optical microscopy and SEM/EDS to map alloy composition and identify inclusions/contaminants and their distribution.
Result: Detection of aluminum deposits and other contaminants associated with improper use of scrap/aluminum in lead refining, leading to accelerated corrosion during formation.
Corrective actions: Review of the refining route, lead specification, and Al limits in the alloy; raw material control and batch-by-batch monitoring upon receipt.
How to Get Started in 3 Steps
Talk to ISI-EQ to understand your needs. We discuss scope, goals, and key performance indicators.
Together, we define the instrument (direct technical service or R&D via Embrapii, Embrapii Sebrae, or SENAI Alliance) and structure the Work Plan and/or budget.
Document checklist: CNPJ, CNAE, Sebrae letter (if applicable), technical targets, designated contacts, and schedule.
Ask Yourself!
Quality & Process
- Do we control D10/D50/D90 and the particle size distribution of leady oxide by batch/supplier?
- Do we monitor our curing process: do we have 3BS/4BS targets by product and measure them through XRD?
- Do we know the size distribution of 3BS/4BS crystals (SEM/EDS) and their impact on shedding and formation?
- Do we measure formation through XRD (?/?-PbO? ratios) and C/S (residual sulfur) to track the process?
- Do our standardized tests show reduced capacity dispersion after adjustments in granulometry/curing/formation?
- Do I know my battery well enough and have sufficient reproducibility to define operating parameters and properly program control systems (BMS)?
New Business & Niches
- Is our portfolio ready for stationary applications (solar/wind, UPS/telecom, off-grid) with specifications for deep cycling/PSoC, retention, water loss, and temperature?
- Do we have the line and process for VRLA/gel/tubular (OPzS/OPzV) batteries aimed at intermittent renewables and backup? What is missing (materials, method, testing, certification)?
- Are we prepared for micromobility (e-bike, e-scooter, tricycles, carts) with high cycling and frequent recharges? What is the cost per cycle and per km compared to market targets?
- Is there an opportunity in light intralogistics (pallet trucks, golf carts, sweepers) with PSoC-robust versions?
- Do we have a clear funding path (Embrapii, Sebrae, SENAI Alliance) to enter or expand in these markets?
Opportunities in Stationary Storage and Micromobility
The demand for stationary storage (solar/wind, off-grid, hybrid, and backup) and for micromobility (e-bikes, e-scooters, tricycles, and light traction applications) is growing rapidly and requires predictability: operation in PSoC, many deep cycles, water loss control, and formation adjusted to the usage profile. The package — laser diffraction (oxide), XRD (phases in cured plates and ?/?-PbO? in formed plates), SEM/EDS (crystal size and elemental mapping), and C/S analysis — shortens formation, reduces variability, and increases service life, validated by standardized tests.
Stationary for Intermittent Renewables
Specify D50/particle size distribution of leady oxide and 3BS/4BS targets suitable for deep cycling/PSoC; implement capacity/retention/water loss routines to reduce cost per delivered kWh and enhance the reliability of microgrids and UPS systems.
Micromobility
Microstructure (3BS/4BS) and ?/?-PbO? ratios compatible with high cycling and frequent recharges; C/S and contaminant control to stabilize performance across batches.
Heverson Renan de Freitas
Smart Energy Coordinator
+55 41 98855-1665 (WhatsApp)
Restrictions: funding information is basic and subject to change; please confirm conditions upon contracting.
